HOW TO USE
MOTIF SEARCH
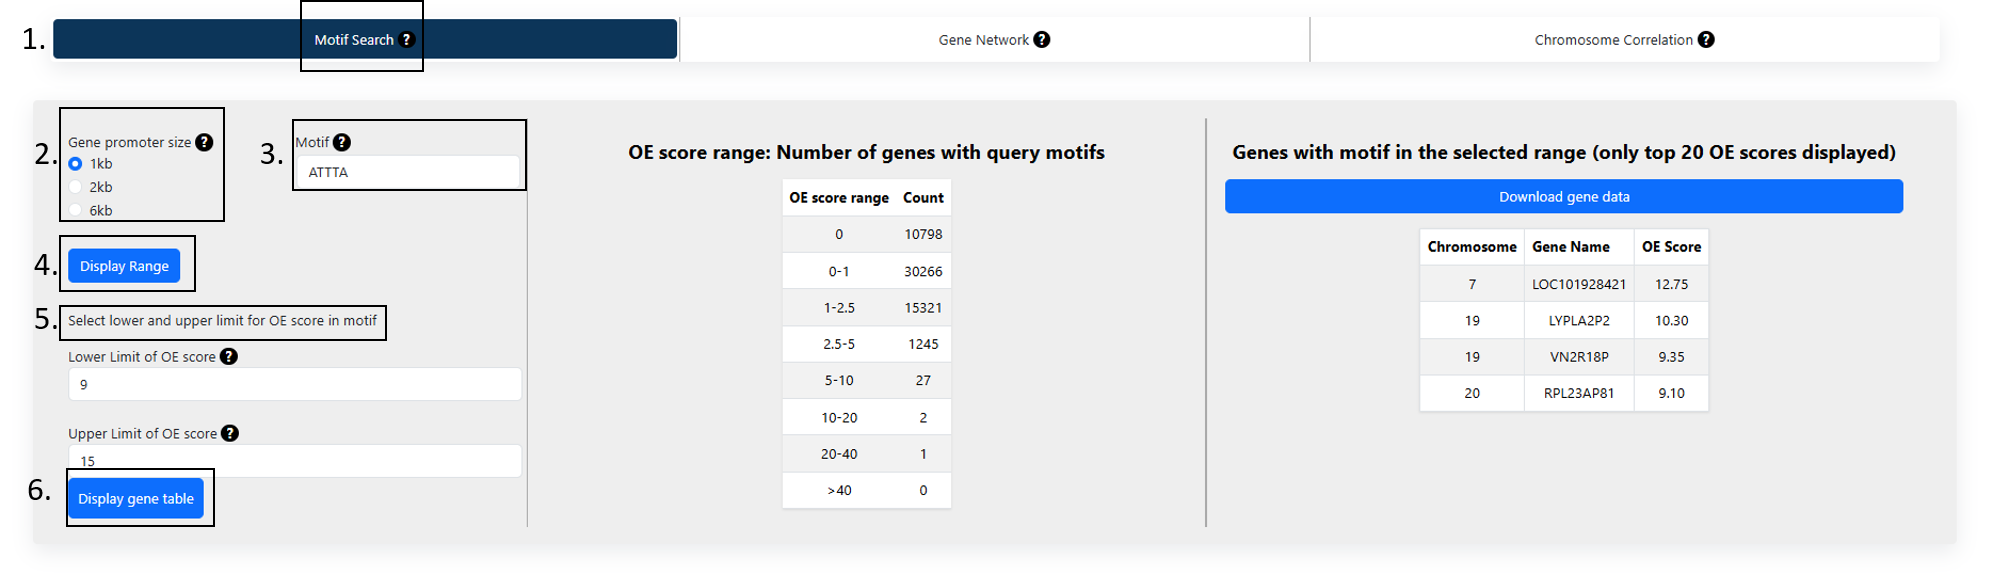 Figure 1
1. Motif Search:
In this tab, users could query the abundance of a query motif in gene promoter regions:
- 5 or 6-letter DNA motif*.
- Select the promoter size. The available options are 1kb, 2kb or 6kb.
This would return a table of abundances in different OE score ranges.
* On this site, we only query 5/6 -mer words. For the logic of this choice, please refer to doi:
https://doi.org/10.1093/nar/gkae1178
2. Gene promoter size:
The region upstream of the gene start site where query motif occurrence is calculated. Select from the three options of 1,2 and 6kb. It represents 1000, 2000 and 6000 bases upstream of the gene start coordinates according to the T2T reference assembly (
https://www.ncbi.nlm.nih.gov/datasets/genome/GCF_009914755.1/).
3. Motif:
Type a continuous stretch of 5 or 6-lettered DNA sequence made of A, T, G or C (For example
ATTTA). Please note that any letters apart from A, T, G or C or motifs less than 5 or more 6 bases will not be recognised. An error message will be displayed in such a case.
4. Display range:
Entering the motif and selecting the promoter size, displays the different ranges of the abundance of the query motif as OE scores. For query motif
ATTTA the display range option generated the OE score range table as shown in
Figure 2.
5. Select lower and upper range of OE score in motif:
Type a lower and upper limit of the OE scores. OE score measures the abundance of the motif in promoter regions normalized by their expected occurrences. It is given by:
Observed count (O): The number of times a motif occurs in the sequence stretch is recorded as the observed count.
Expected count (E) :
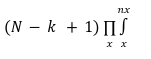
Where
nx is the number of times a particular base occurs in a motif and whose probability is x and N is the size of the chromosome. The OE score is thus a normalized metric considering a chromosome's AT/GC richness. Given that there are 4 bases (A/T/G/C), the number of motifs of size k = (5 or 6) would be 4k. Here we average the OE scores for motifs and their reverse complements. These averaged OE ratios taken together are called the motif vector.
For query motif
ATTTA the display range option generated the OE score range table as shown in
Figure 2.
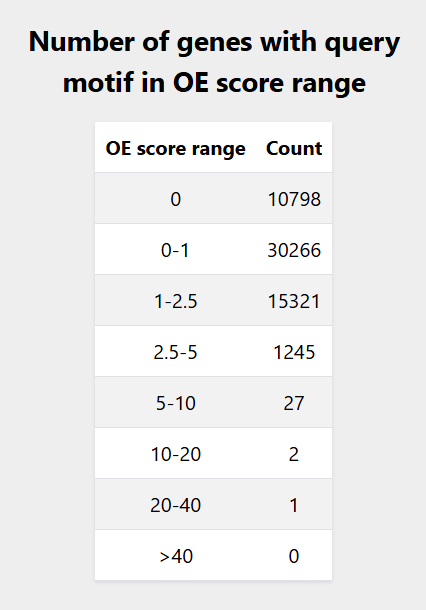 Figure 2
6. Display gene table:
By selecting the lower and upper limits of the OE ratios, results of the genes in whose promoters this motif is found in the specified interval are displayed. Note that the table is limited only to the top 20 genes. The download button fetches the entire list within the range. An OE score limit of
9 and 15 for query gene
ATTTA gives the following output of
4 genes as shown in
Figure 3.
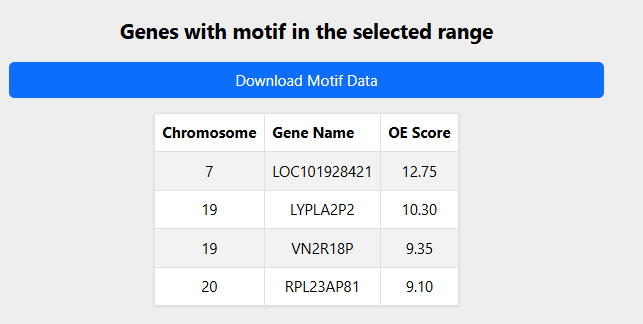 Figure 3
SINGLE GENE QUERY
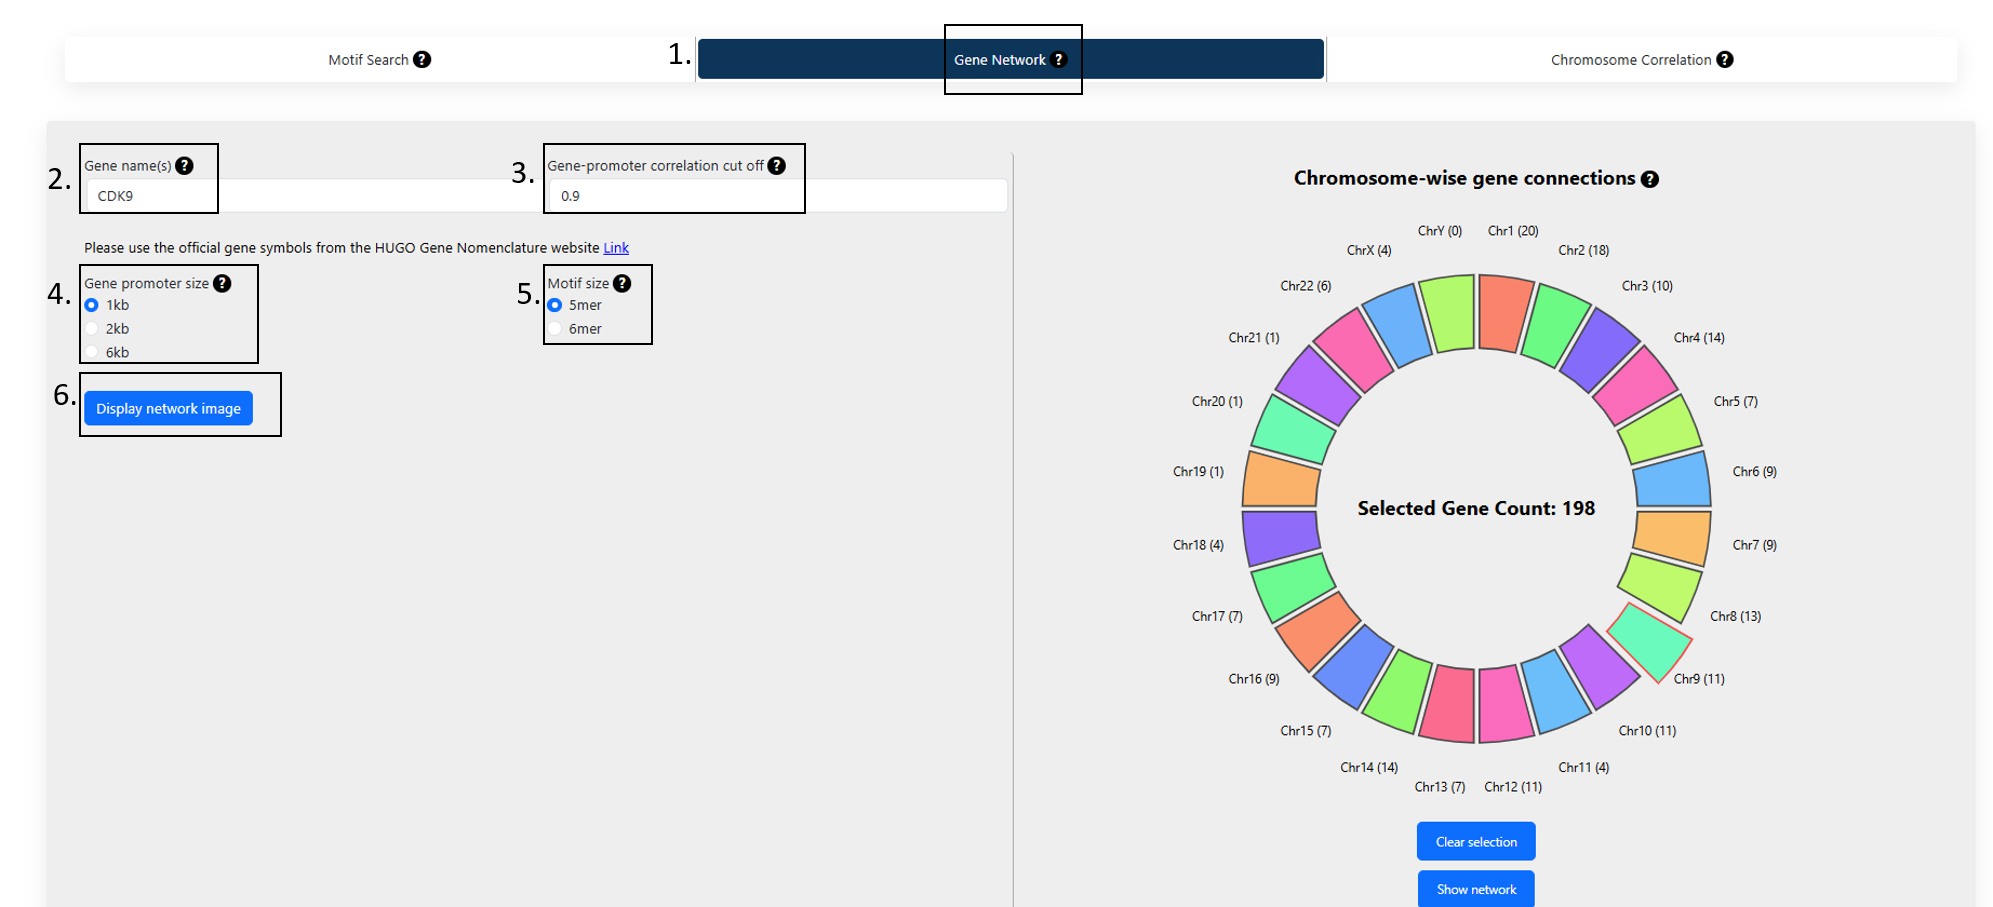 Figure 1
1. Gene(s) network:
To find the connections to a single query gene of interest based on the abundance of motifs in the gene promoter regions:
- Type in a gene name.
- Select a correlation cutoff based on motif abundances.
- Select the promoter size. The available options are 1kb, 2kb or 6kb.
- Select motif size. The available options are 5 and 6*.
* On this site, we only query 5/6 -mer words. For the logic of this choice, please refer to doi:
https://doi.org/10.1093/nar/gkae1178
2. Gene name:
The official gene symbol of the query gene to be entered here. Please note any other format other than the one mentioned in HUGO nomenclature
https://www.genenames.org/tools/search/#!/?query=&rows=20&start=0&filter=document_type:gene.
3. Gene promoter correlation cutoff:
It is the correlation score between two gene promoters based on the abundance of the motifs. The value ranges from -1 to +1. A correlation score of the
motif vectors is computed based resolution selected by the user. The correlation between two motif vectors, X and Y, is computed as:
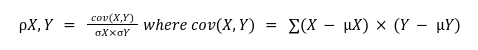
Where cov(X,Y) is the covariance, (X and Y) and (X and Y) are the means and standard deviations of OE scores of motif vectors X and Y respectively (for more details on motif vector and OE scores refer to motif search section under help).
4. Gene promoter size:
The region upstream of the gene start site where query motif occurrence is calculated. Select from the three options of 1,2 and 6kb. It represents 1000, 2000 and 6000 bases upstream of the gene start coordinates according to the T2T reference assembly.
5. Motif Size:
The size of the DNA words at which the gene promoter is read. Select from the two options of 5 or 6.
6. Display network:
The option generates visual representations of the connections with the query genes in two formats:
- A circle on the right shows the number of gene promoter pairs with correlations greater than the cutoff, across different chromosomes. The chromosome where the query gene is located is highlighted in red and extended out of the circle. The query gene CDK9 is located in chromosome 9 as shown in Figure 2.
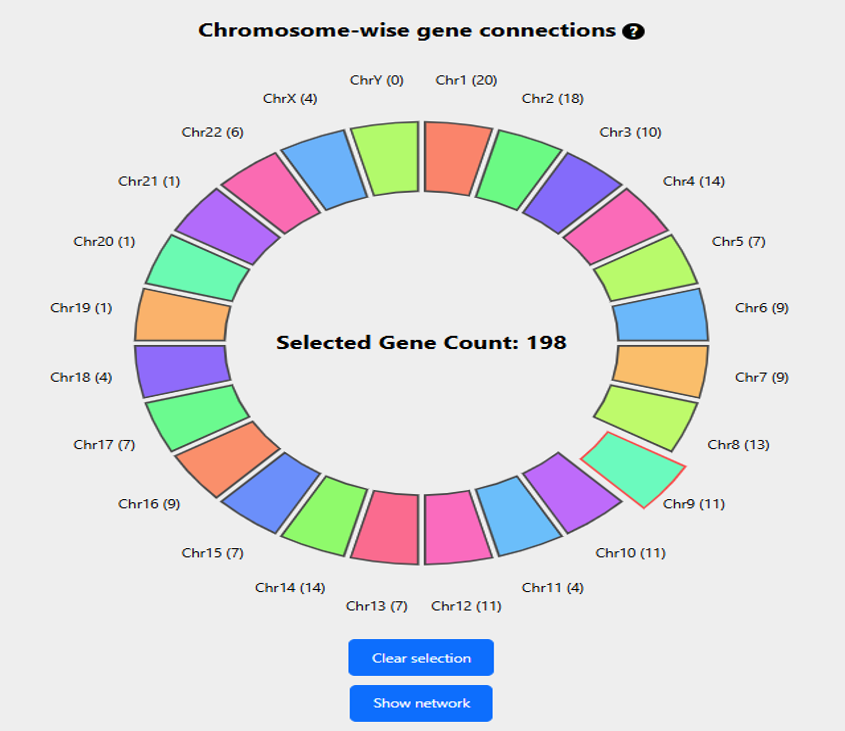 Figure 2
- A network of all the genes correlated with the query gene at the mentioned cutoff. Click on the “Show network” option to visualize the network of genes correlated. The query gene is highlighted in a larger form in the network is highlighted in our example case of CDK9 as shown in Figure 3.
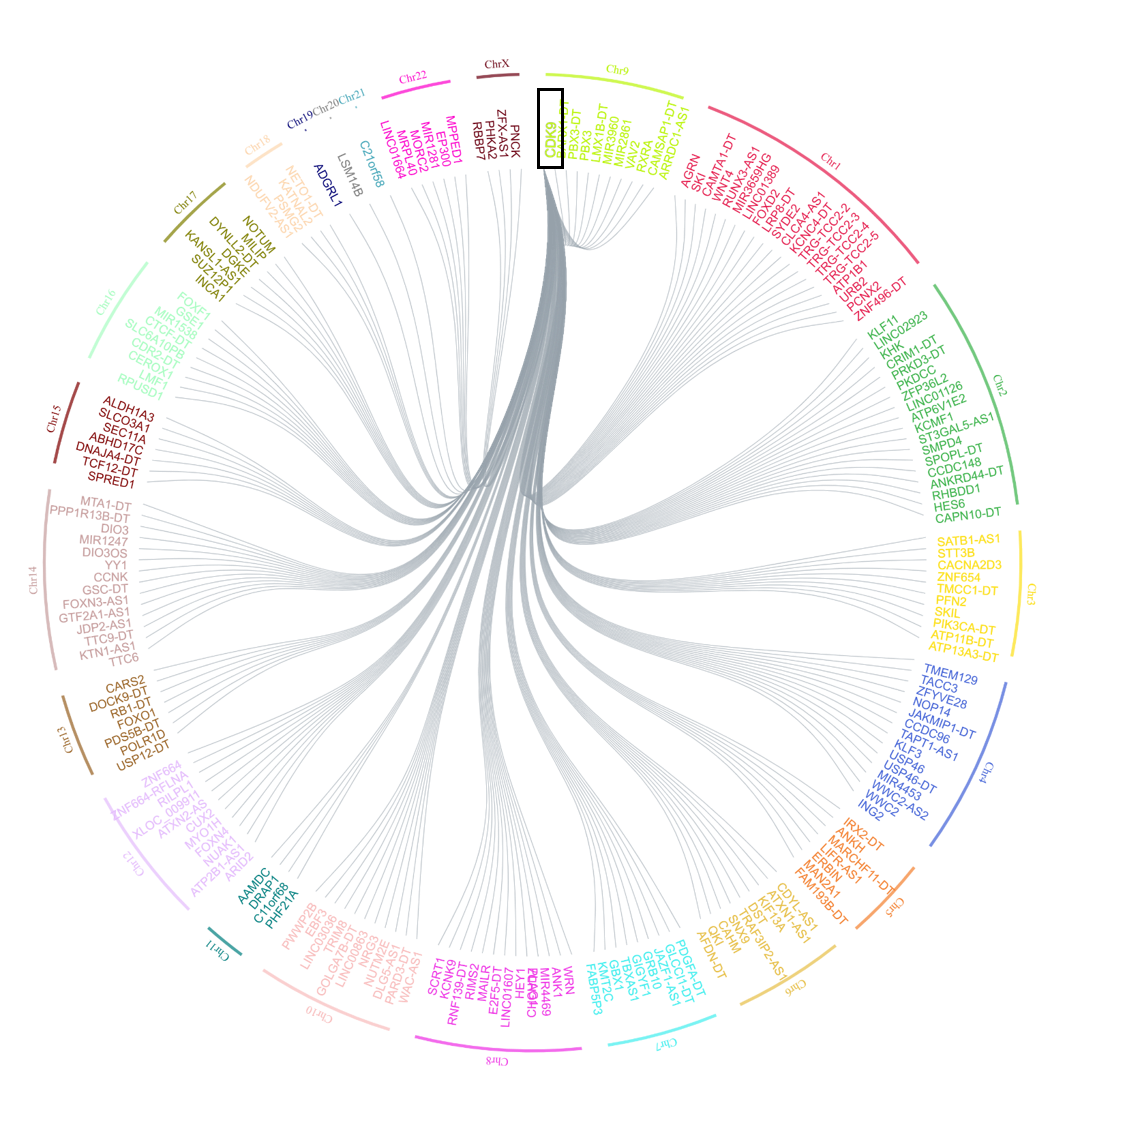 Figure 3
Click on the chromosomes in the circle mentioned in a. to add or remove the genes from the selected chromosome into the network. Hovering over the gene name displays the motifs table with the top 5 OE scores (
figure 4). Gene
KLF3 in chromosome 4 correlates with
CDK9 above the
selected cutoff of 0.9. The common motifs among the motifs with the top 10 highest OE scores are highlighted in red. Only 5 top motifs are displayed. Double-click on the gene to download the motif OE scores for all the genes. A single click on the gene will direct the user to the UCSC genome browser page for the selected gene. To save the network image as a high-resolution
.png image click on the
“Download network image” option. To download the complete data and the detailed correlation values of the genes in the network as a
.csv file, click on the
“Download data” option.
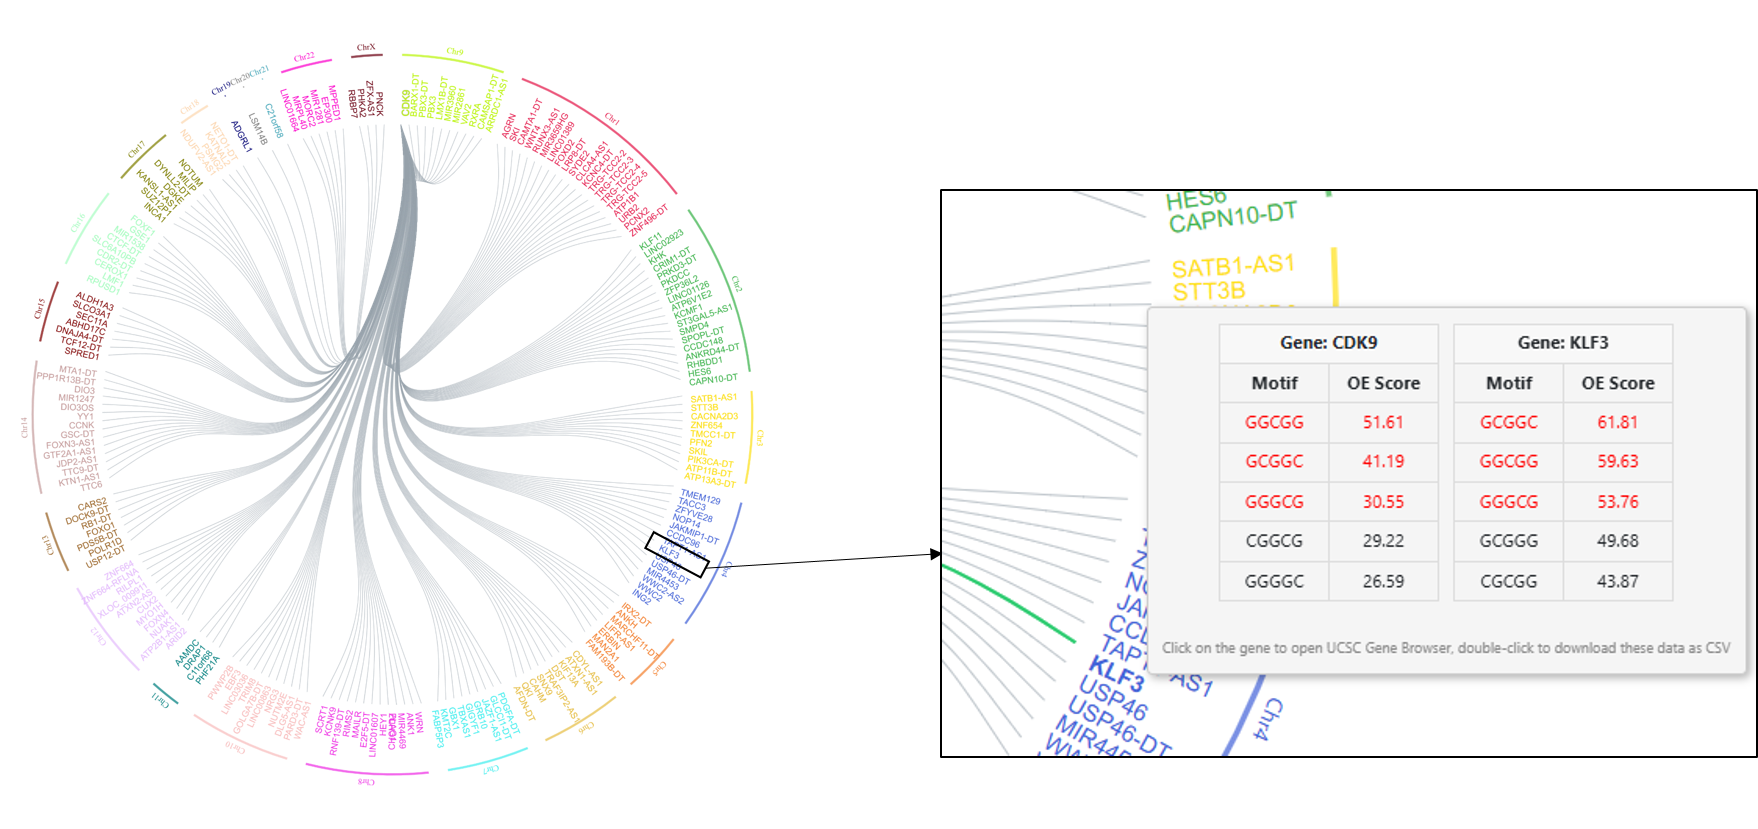 Figure 4
MULTI GENES QUERY
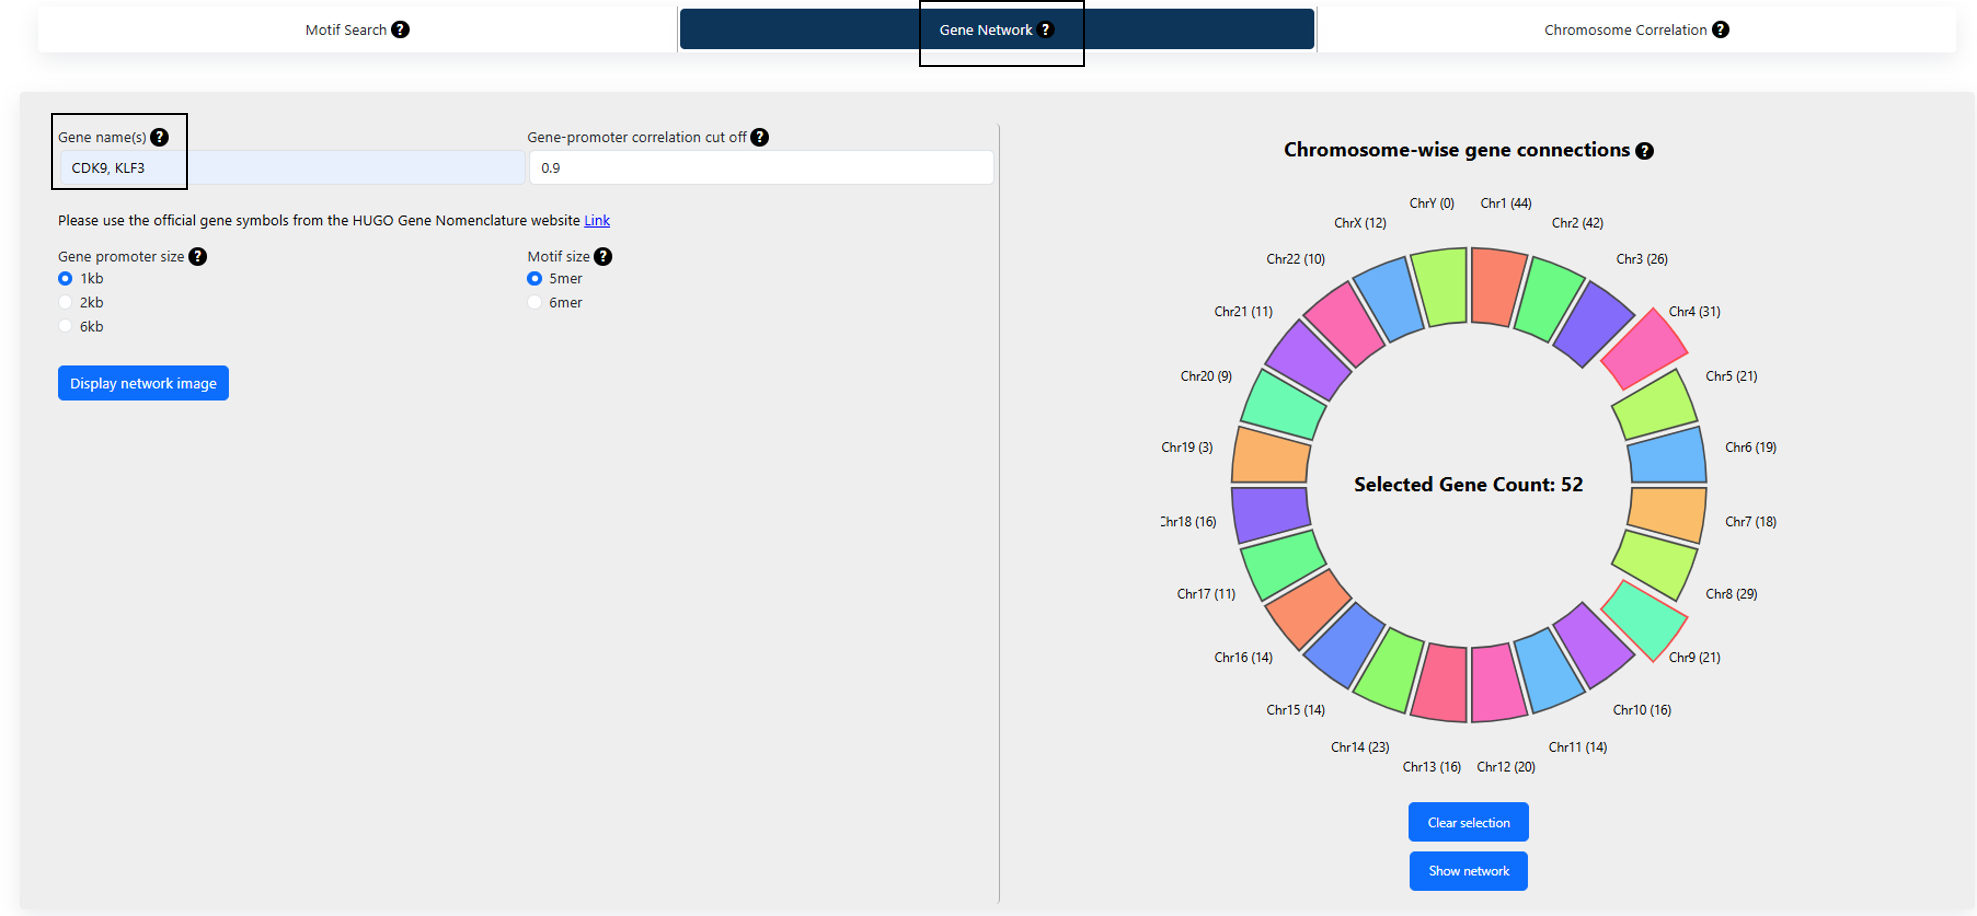 Figure 1
1. Multiple Gene query:
For multiple gene queries, enter the gene names in that official gene symbol format as mentioned in the section on a single gene. The gene names should be comma-separated. Choose a promoter correlation cutoff to visualise the gene correlated to the query genes and also the common overlaps. For details on promoter correlation cutoff refer to the help section of the
single gene query.
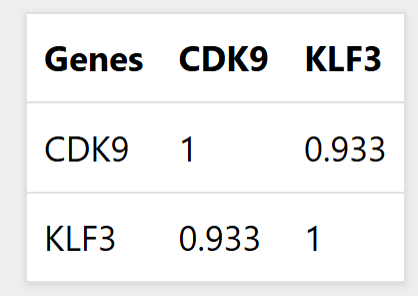 Figure 2
The correlation between the query genes at the selected
promoter and
motif size is displayed in a table as shown in
Figure 2. The network of gene connections for multiple gene queries by default shows the gene correlations at the specified cutoff only for the genes in the same chromosome as the query genes as shown in
Figure 3. Genes from different chromosomes can be added to the network by selecting the chromosomes in the circle (same as
single gene query) as shown in
Figure 3. The genes connection chromosomes of the query genes (
chromosome 9 for
CDK9 and
chromosome 4 for
KLF3) are highlighted in green and blue respectively as shown in
Figure 3.
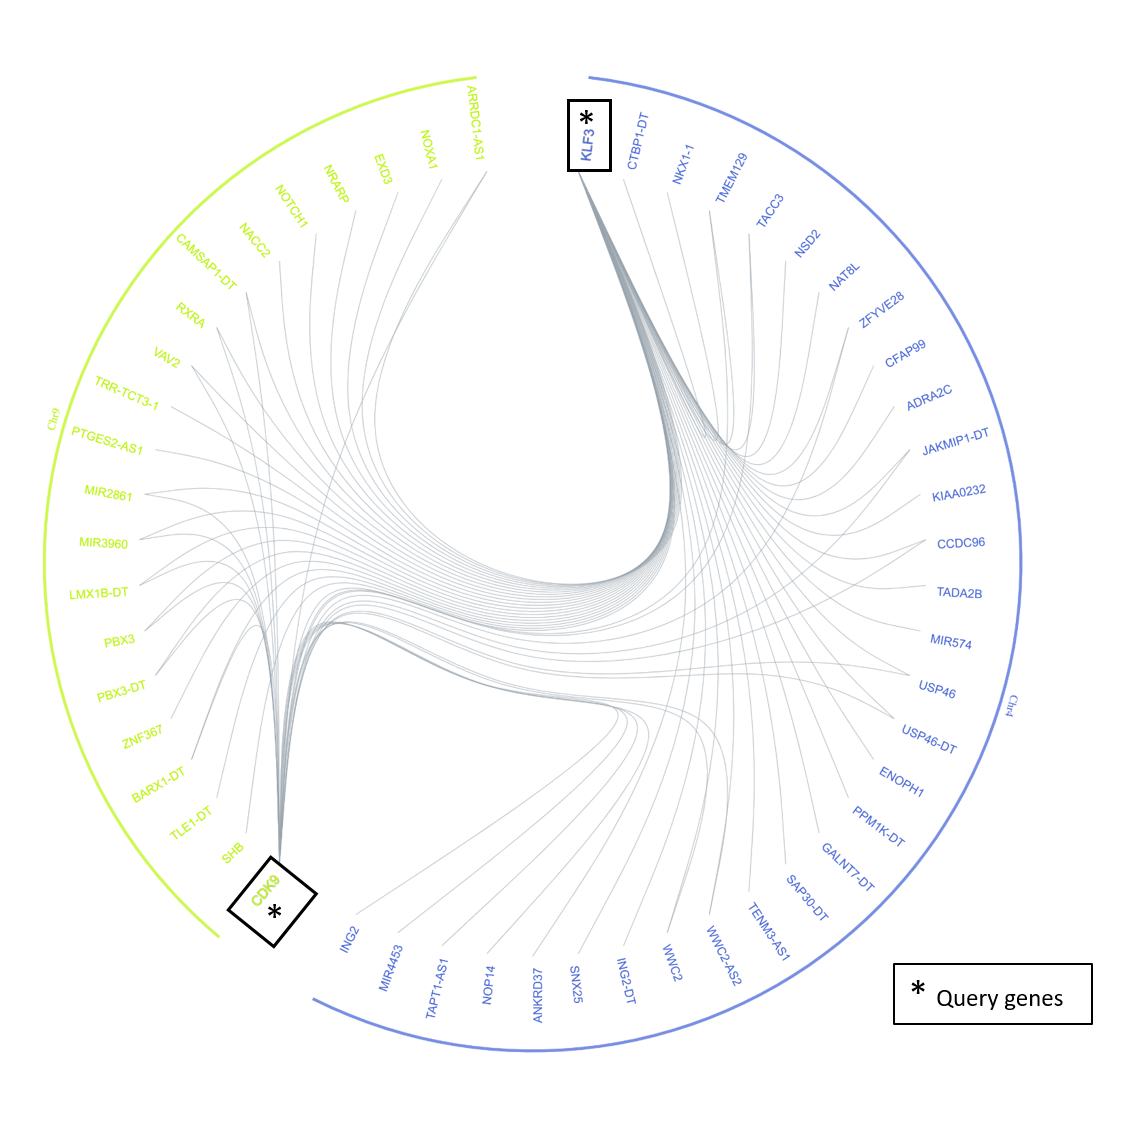 Figure 3
The common genes connected to both the query genes at the selected cutoff will be connected by two lines (two green lines highlighted in
Figure 4). Hovering over the common gene name displays the motifs table with the top 5 OE scores in all the query genes and the connected genes (
Figure 4).
USP46 in
chromosome 4 share a correlation above 0.9 with both
CDK9 and
KLF3 as shown in
Figure 4. The common motifs among the motifs with the top 10 highest OE scores are highlighted in red. Only 5 top motifs are displayed. A single click on the gene will direct the user to the UCSC genome browser page for the selected gene. Double-click on the gene to download the motif OE scores for all the genes. To save the network image as a high-resolution
.png image click on the
“Download network image” option. To download the complete data and the detailed correlation values of the genes in the network as a
.csv file, click on the
“Download data” option.
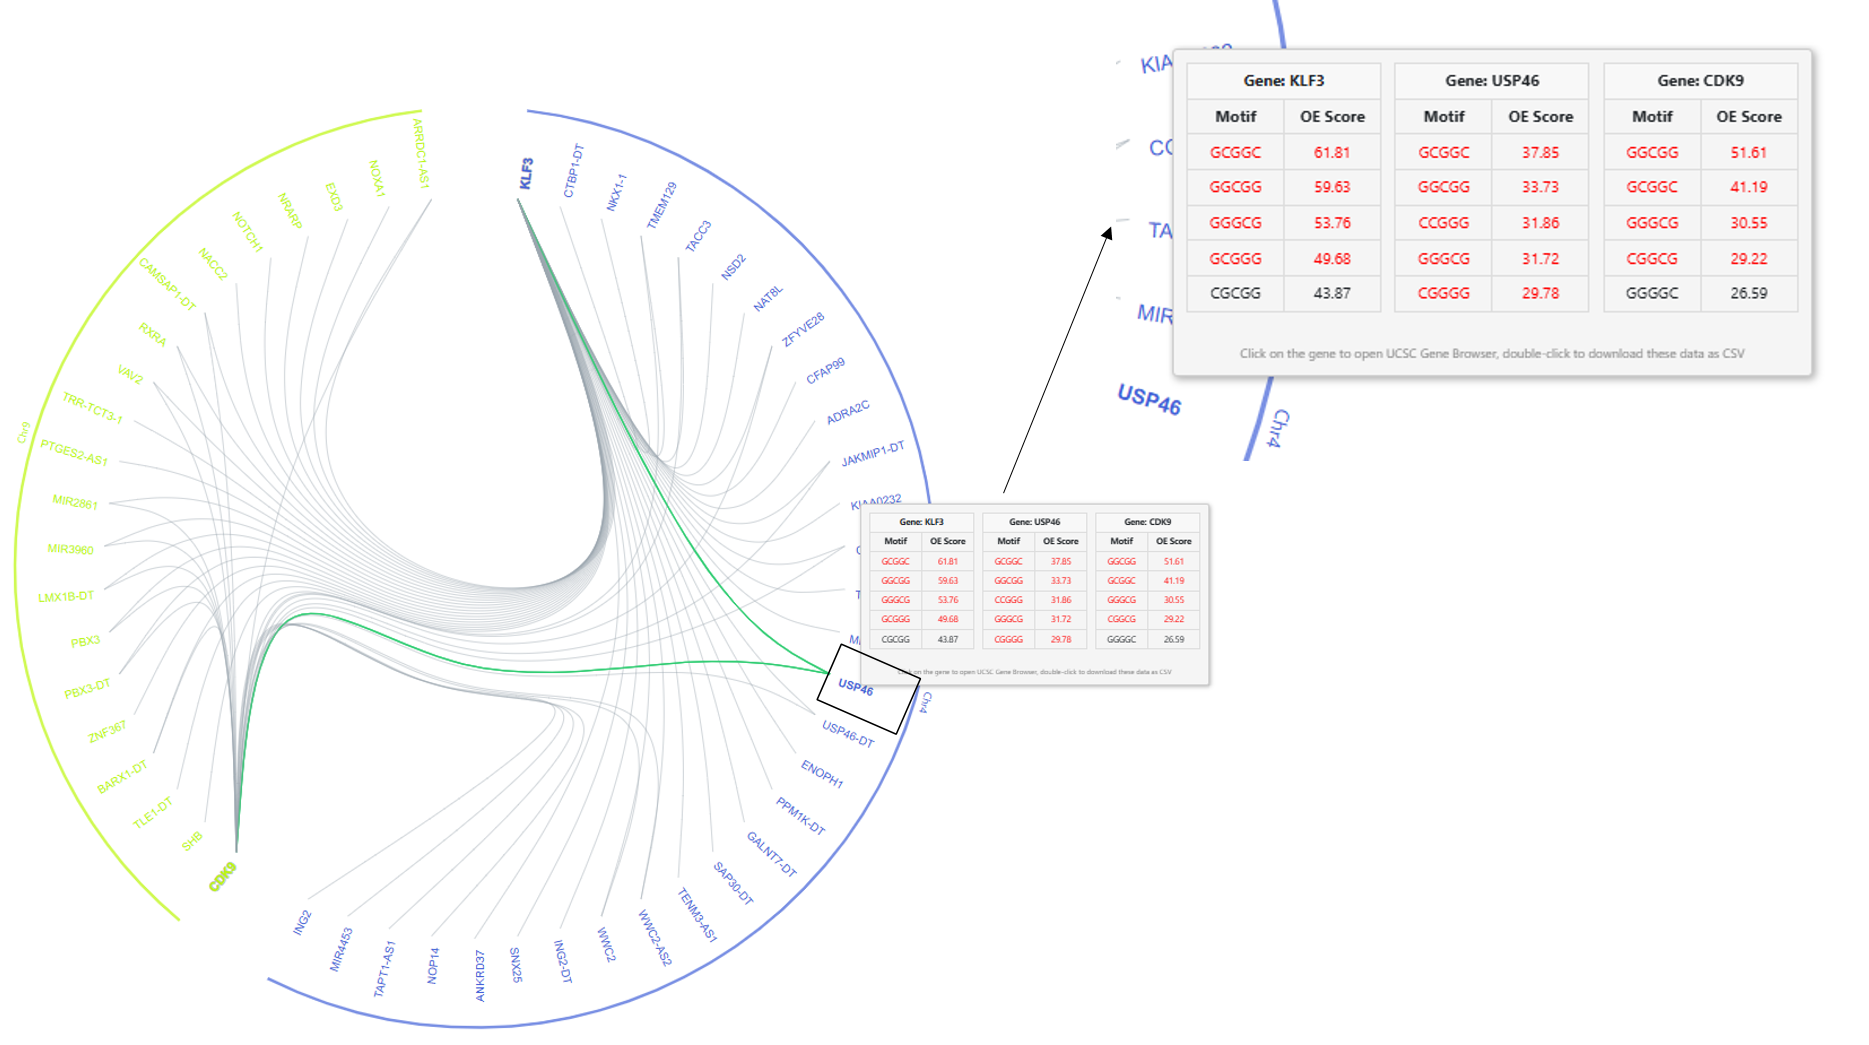 Figure 4
CHROMOSOME CORRELATION
 Figure 1
1. Chromosome correlation:
To search for the number of gene correlations for a particular chromosome pair in the form of a heatmap:
- Move the slider to a promoter correlation cutoff
- Select a promoter size of a query motif in gene promoter regions.
- Select a motif size
- Select a display type.
For details on the
promoter size and
motif size refer to the help section of the single gene query.
2. Gene promoter correlation cutoff:
Move the slider to a correlation cutoff. For more details on how the correlation cutoff is calculated based on the promoter size and motif size refer to the help section of the
single gene query. The slider has correlation cutoff options of <0, 0.1, to 1, with an increasing difference of 0.1.
3. Display type:
On selecting the parameters, a heat map shows the number of gene pair correlations between all chromosome pairs. The display type of contacts generates the heatmap based on the absolute count of the gene pair correlations for all the chromosome pairs. The higher (or lower) the number of gene pair correlations, the darker the shade of red (or green). Selecting a display type of ratio gives a normalized count of the gene pair correlations above the selected cutoff based on the total possible connections for the chromosome pair. The value ranges from 0 to 1. The colour scale of the heat map remains the same.
Figure 2 shows an example of a contact map of gene correlations across chromosomes at a cutoff of 0.9 and motif size 5.
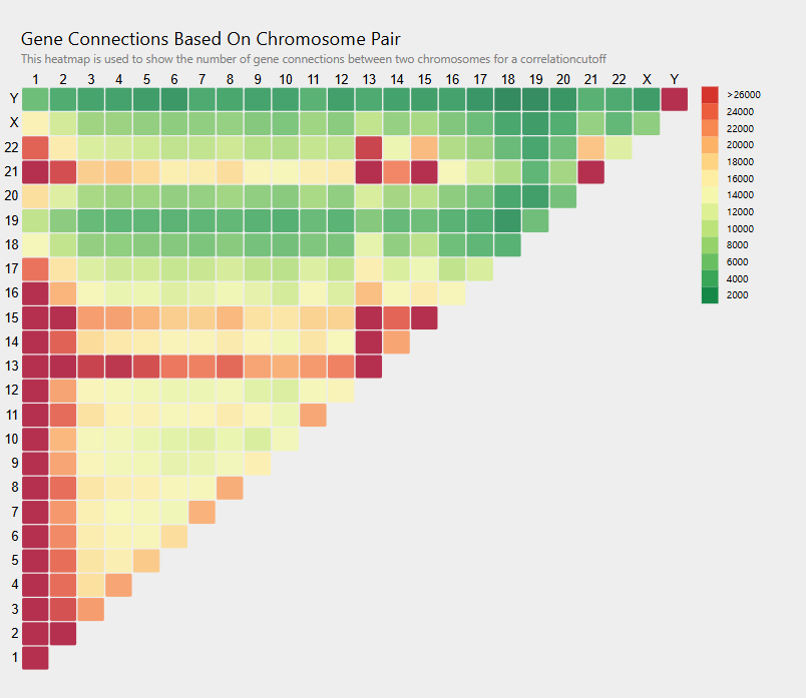 Figure 2
EXAMPLES
Example1:
Finding motif abundances across genes:
We queried MAGNETIC for the abundance of the motif CACGTG (E box), a reported consensus motif recognized by the transcription factor Myc. The search was done 1kb upstream of gene start site. In the table of OE value ranges and genes, 4 genes had OE values in the range of 40-60 and 87 genes in the range of 20 to 40. The output displayed the top 20 genes with the highest OE scores. Of these 20 genes, we further considered only the 12 protein coding genes and excluded the non-characterized genes or the long coding RNA genes. Of these 12 genes, GOLIM4 had the least OE score of 29.00.
 Figure 1
Example2:
Genes associated with GET4 also share a common transcription factor:
As an example of using MAGNETIC to find associations of a query gene of interest, we input the gene GET4. This gene was identified in the previous example as the one with the highest abundance of Myc Consensus Motif (Result section 1). At correlation coefficient cutoff values of 0.50, 0.55 and 0.58, we get 1626, 247 and 27 gene associations, respectively, with a promoter size of 1kb and motif size of 6mer.
 Figure 2
Example3:
Genes with shared promoters from inter- and intra-chromosome gene correlations:
Using the chromosome correlation tab on MAGNETIC with the correlation coefficient threshold set to 1.0 (identical motif distributions) for 1kb promoters and 5mer motifs, we obtained an inter and intra-chromosome correlation heatmap. The highest inter-chromosome correlations were between 14 and 21 (figure 3). For this chromosome pair, 758 gene pairs involving 16 genes from chromosome 14 and 55 from chromosome 21 had a correlation coefficient 1. On alignment, the promoters were, on average, 96.8% identical to one another. These two chromosomes are known to undergo Robertsonian translocations. It is likely that the near-identical promoter regions of the genes in this part of these chromosomes are an important factor influencing the translocations.
Examining gene pairs within chromosome 20 revealed 9 gene pairs with a correlation coefficient 1. These have shared promoters.
 Figure 3

